By Mamello Matikinca-Ngwenya, Siphamandla Mkhwanazi, Thanda Sithole & Koketso Mano
Analysing gross fixed capital formation trends
Following our analysis of the latest GDP data release, we now turn our attention to gross fixed capital formation (fixed investment), a vital component of the GDP identity, to evaluate its trajectory. This assessment is pivotal given current conditions, including subdued business confidence and a low employment-to-population ratio. In 2023, fixed investment expanded by 4.2%, slightly below our forecast of 5.0%, primarily due to lower-than-expected growth in public sector investment. Private sector investment closely aligned with our forecast of 4.8%, coming in at 4.9%, while total fixed investment as a share of GDP stood at 15.1%, below the 17.5% average recorded between 2010 and 2019 and the 30% National Development Plan (NDP) target for 2030.
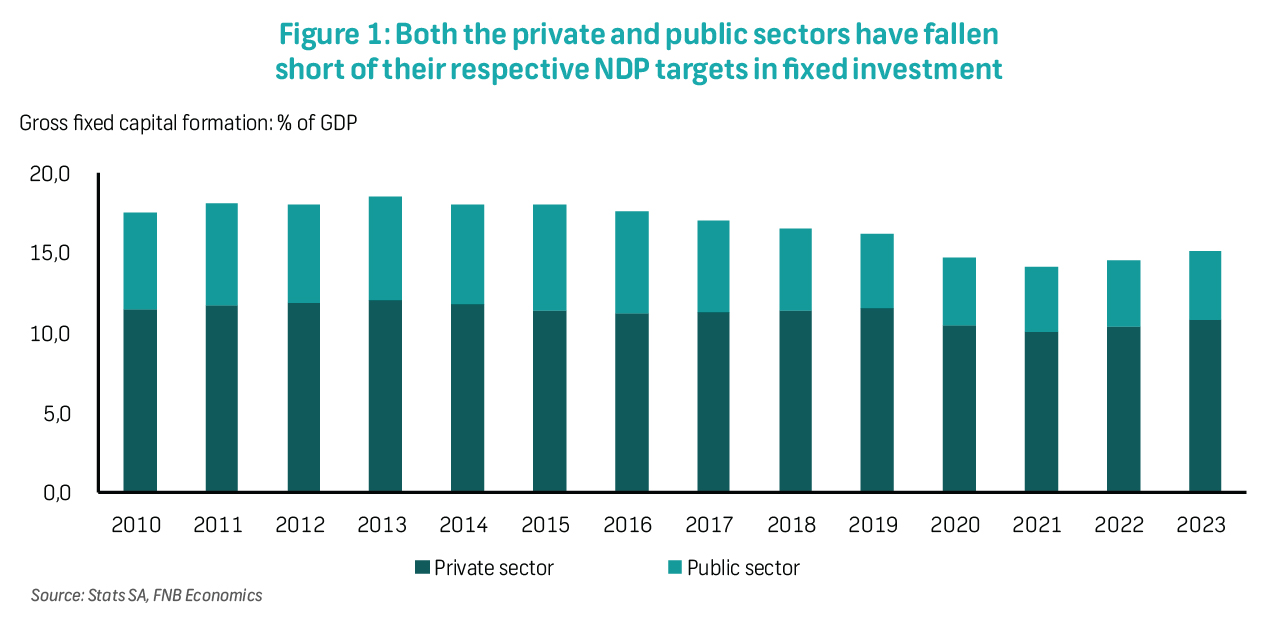
Fixed investment by the private sector currently accounts for around 10.8% of GDP, and the public sector contributes another 4.3%, both falling short of NDP targets. Private sector fixed investment remains 5.9% below its pre-pandemic 2019 peak of R529 billion, reflecting a protracted recovery amidst widespread dissatisfaction with business conditions, as evidenced by the BER Business Confidence Index which dropped further at the start of 2024. Public sector fixed investment also remains below pre-pandemic levels, constrained by fiscal challenges and diverted spending away from critical economic infrastructure.
While fixed investment growth has been robust in the most recent period, it has been uneven across sectors and assets (as reflected below). Implementing growth-enhancing reforms, including measures to safeguard critical infrastructure, will be crucial for broadening investment growth across all sectors and assets, contributing to economic recovery and development.
Fixed investment by sector
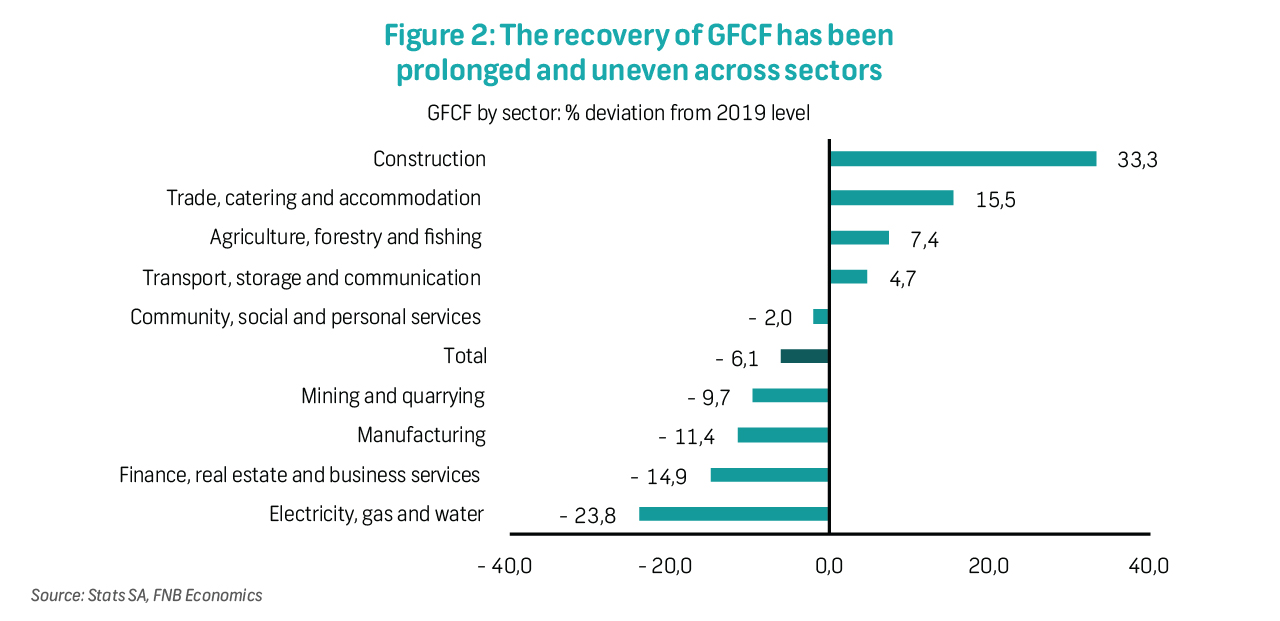
Since 2019, fixed investment by the construction sector has experienced rapid growth, averaging 7.5% per annum between 2020 and 2023. By the end of 2023, fixed investment by this sector was 33% above its pre-pandemic level of R12.8 billion. Similarly, the trade, catering, and accommodation sector saw faster growth, averaging 4.0% over the corresponding period, reaching a 15.5% increase compared to its 2019 level. In addition, fixed investment by the agriculture, forestry, and fishing sector grew by 2.0%, sitting 7.4% above its 2019 level, while the transport, storage, and communication sector experienced 1.8% average growth and settled 4.7% above its 2019 level by the end of last year. However, fixed investment declined in the rest of the other five sectors.
Fixed investment by type of assets
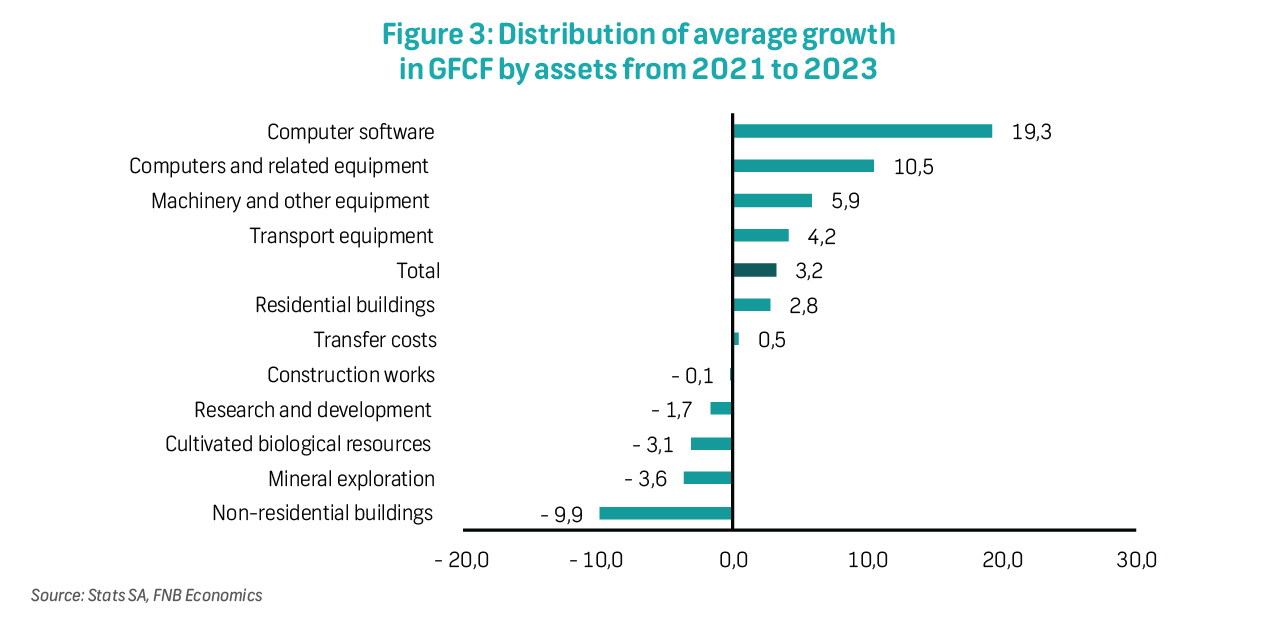
When examining fixed investment by type of assets, excluding the 2020 pandemic year, growth in the 2021 to 2023 period was robust, particularly in computer software, which saw a growth rate of 19.3%. This reflects corporate efforts to enhance operational efficiency, productivity, and technological capabilities. Investment in computers and related equipment experienced average growth of 10.5%, settling 14.6% above its 2019 level. Computer software, computers, and related equipment accounted for 10.7% of total fixed investment.
Fixed investment in machinery and other equipment, driven by ongoing renewable energy reforms, increased by 5.9% over the period. Similarly, investment in transport equipment increased by an average of 4.2%, reflecting the replacement cycle and expansion of vehicles, including heavy trucks, for road freight transportation amid challenges in the freight rail sector.
Investment in residential buildings grew by 2.8% on average but experienced a decline in 2023 due to weakened activity in the residential property market amid high interest rates. Other assets, such as non-residential buildings, construction works, research and development, mineral exploration, and cultivated biological resources, experienced declines over the post-pandemic period.
Week in review
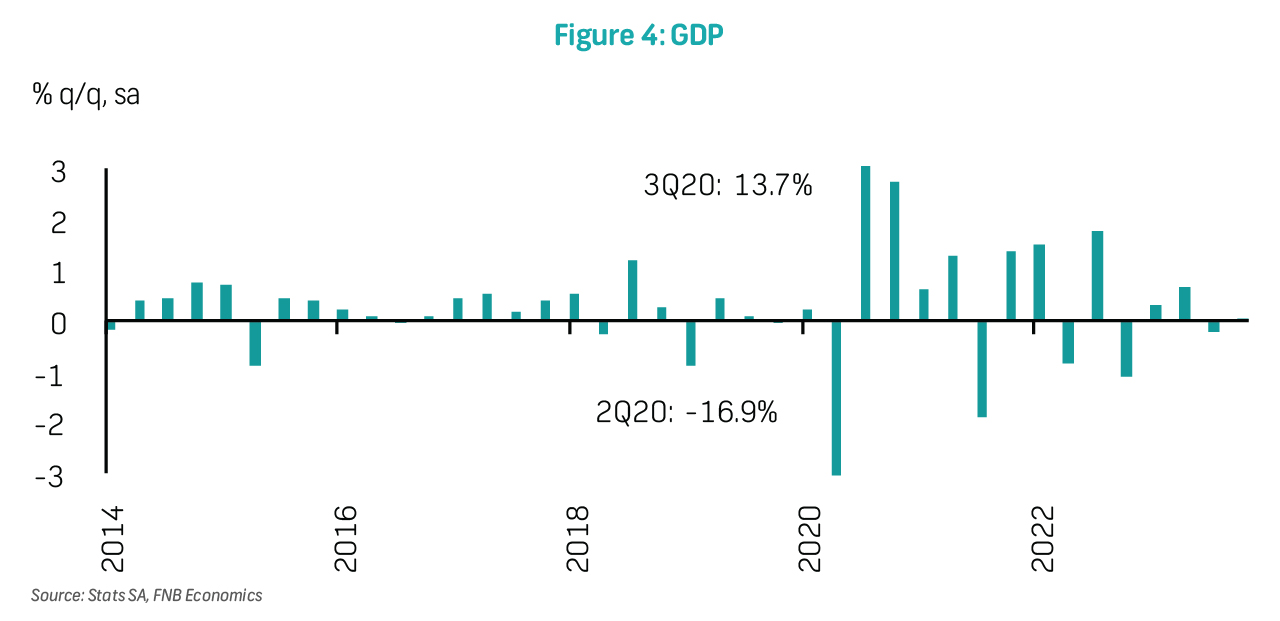
GDP narrowly avoided a technical recession in 4Q23, growing by 0.1% q/q, rebounding from a 0.2% contraction in the previous quarter. However, this growth fell below expectations, particularly with the agriculture sector experiencing a significant decline. Compared to the same quarter in 2022, the economy expanded by 1.2%, indicating faster growth than the previous quarter. Six out of ten sectors contributed to quarterly growth, with the transport, storage, and communication sector leading the way, expanding by 2.9% and adding 0.2 percentage points. Modest growth was recorded in mining and quarrying; electricity, gas, and water; finance, real estate and business services; personal services; and manufacturing sectors. Household consumption expenditure saw a slight increase, while fixed investment declined mildly. Inventories increased, and the trade deficit widened due to faster import growth compared to exports. In 2023, the economy expanded by 0.6%, aligning with our expectations. A gradual improvement in the medium term is anticipated, with growth expected to reach 1.3% this year and 1.8% by 2026. This growth will be supported by easing infrastructure challenges and ongoing reforms in the energy sector. However, key risks remain, including infrastructure deterioration, geopolitical tensions, and limited domestic demand due to persistent inflation, delayed interest rate cuts, and limited labour income growth.
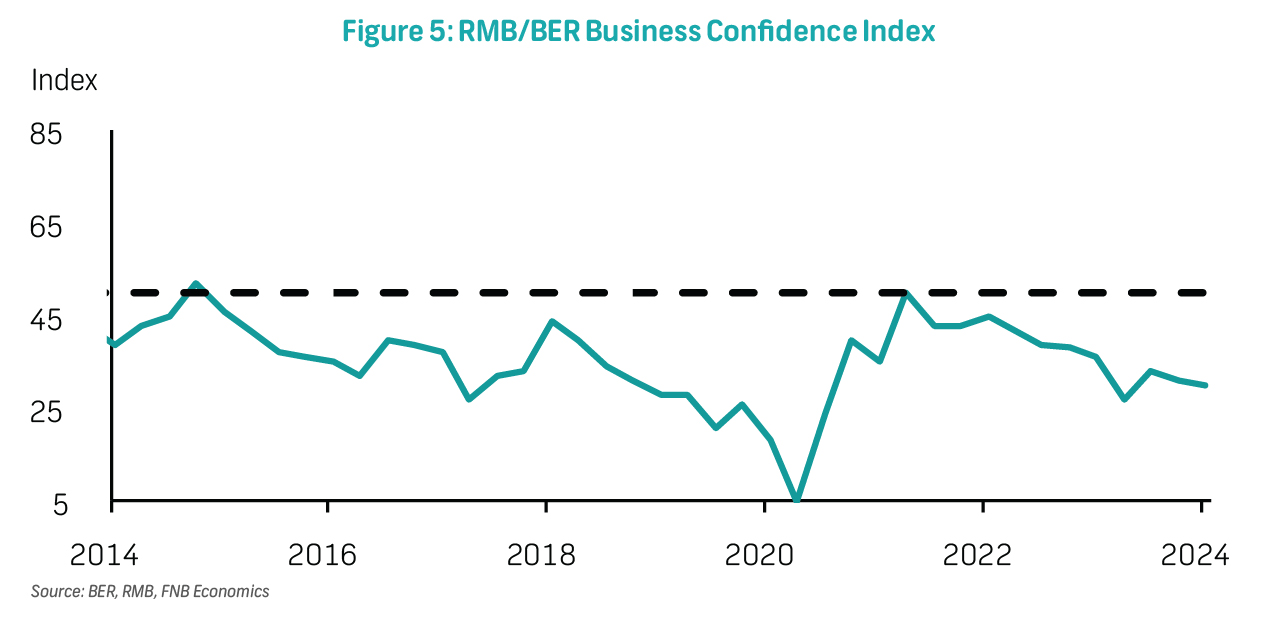
The RMB/BER Business Confidence Index (BCI) notched even lower in 1Q24, reaching 30 index points from 31 points previously. These results reveal a concerning picture of the business climate in the country, with more than six out of ten respondents being dissatisfied with business conditions over the past seven quarters. Despite an improvement in the sentiment of new vehicle dealers at the start of this year, the deterioration in retailer and manufacturer confidence was material enough to result in lower overall confidence. This is while the confidence of wholesalers and building contractors remained broadly unchanged. Concerningly, business activity and investment intensions remained weak, with respondents highlighting structural constraints, crime, and political uncertainty as key issues. In addition, selling prices have started lifting, which poses upside risk to the inflation outlook.
Gross foreign exchange reserves increased slightly to $61.65 billion in February from $61.19 billion in January. This reflected an increase in foreign exchange reserves to $47.25 billion from $46.73 billion, supported by a foreign currency loan of EUR500 million received on behalf of the government. Meanwhile, a marginal drop in gold reserves to $8.18 billion from $8.22 billion was due to the decline in the US dollar price of gold. Special Drawing Rights holdings also fell slightly to $6.22 billion from $6.24 billion, partly reflecting valuation adjustments as the US dollar appreciated.
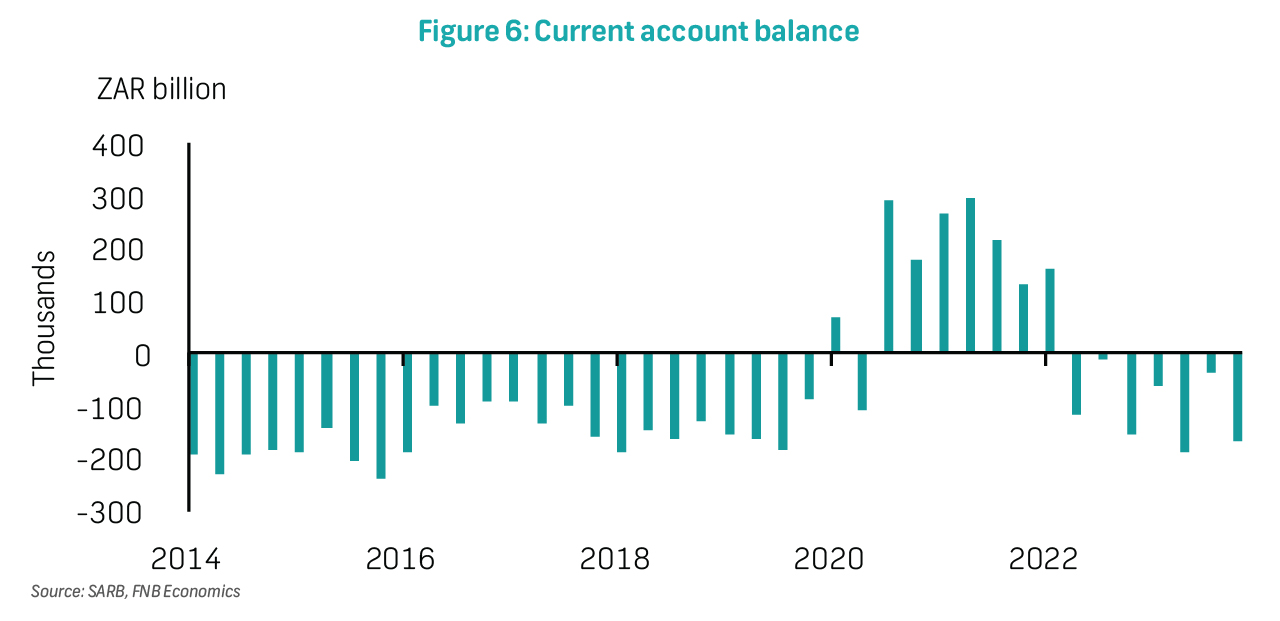
The current account deficit worsened materially in 4Q23, widening to R165.5 billion from R34.4 billion (revised from R19.3 billion) in 3Q23. As a percentage of GDP, the current account deficit was 2.3%, compared to 0.5% (revised from 0.3%) previously. For 2023, the current account deficit widened to 1.6% of GDP versus 0.5% in 2022. The widening of the current account deficit was driven by a smaller trade surplus on goods from 2.6% of GDP to 1.2% between 3Q23 and 4Q23, and 3.4% to 1.5% between 2022 and 2023. This reflected a faster rise in import values, both volumes and prices, relative to exports. Meanwhile the services, income, and current transfers balance worsened to 3.6% of GDP in 4Q23 versus 3.1% previously but recorded a narrowing to 3.1% over 2023 from 3.8% in 2022. Consensus expectations are for an even wider current account deficit over the forecast period, as logistical constraints, and weak global growth weigh on external trade.
Electricity production increased by 0.8% y/y in January, slower than the 4.4% increase recorded in December 2023. Seasonally adjusted electricity production started the year on the back foot, declining by 1.7% m/m after expanding by 0.9% in December and by 2.6% q/q in 4Q23. This reflects the generation capacity challenges the energy sector reportedly experienced in January. The Energy Availability Factor stood at 51.59% by the end of January but showed improvement to 54.53% by the week ending on 26 February 2024. This uptick suggests the potential for improved electricity production in February, which would bode well for 1Q24 GDP growth.
Week ahead
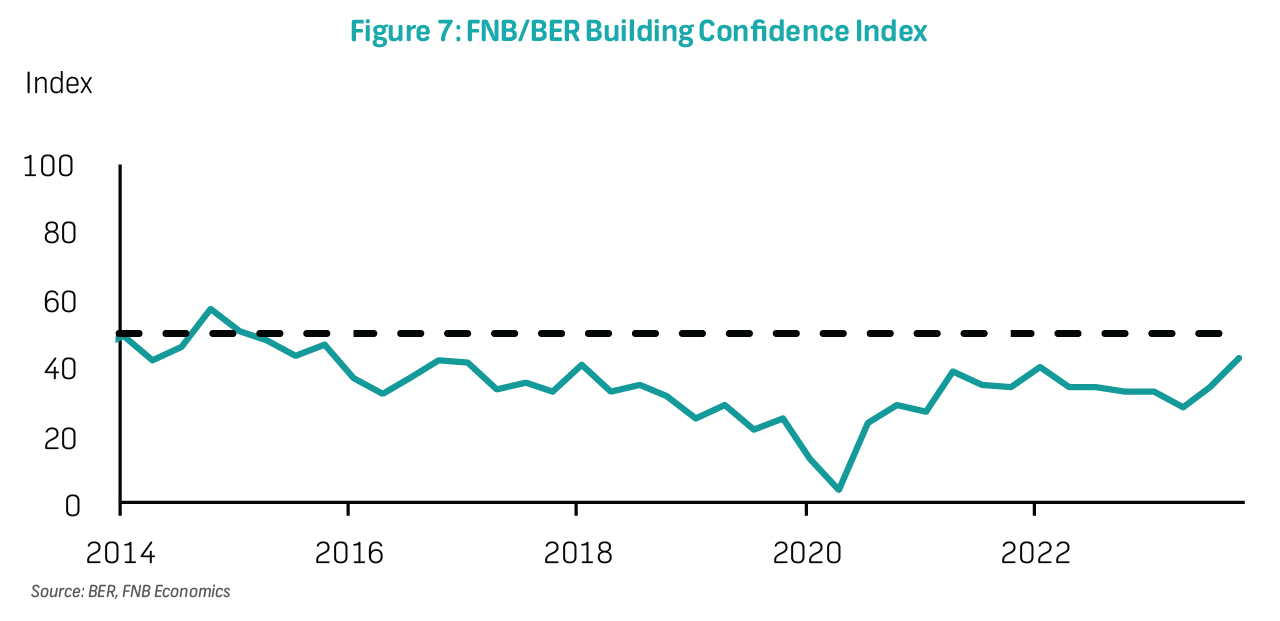
On Monday, the FNB/BER Building Confidence Index survey results for 1Q24 will be published. The Building Confidence Index gained nine points to reach 43 index points in 4Q23, the highest level in eight years. Overall confidence was spurred by a 24-point increase in the sentiment of architects, while hardware retailers also saw their confidence increase by 18 points, although coming from a depressed position. While the overall results were reasonably upbeat, the divergence between the residential and non-residential sub-segments remained evident. Although activity for residential building work still held up well, order books deteriorated. Meanwhile, non-residential builders were optimistic (confidence moved further above 50) partly due to much better overall profitability.
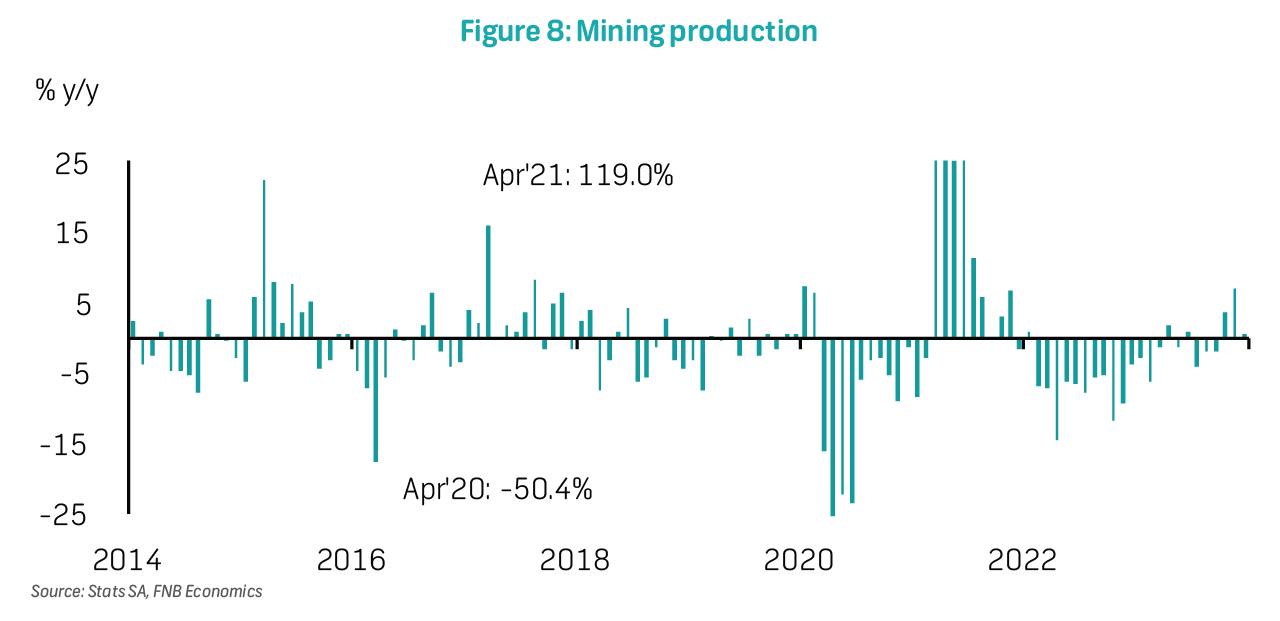
On Thursday, mining production for January will be released. In December 2023, total mining output expanded by 0.6% y/y, reflecting modest growth compared to the robust 6.9% y/y expansion in November. Monthly mining output experienced a sharp decline of 4.2% following an upwardly revised 2.7% increase in the previous month. Despite energy, ports and rail challenges, the mining sector's Gross Value Added (GVA) expanded by 2.4% q/q in 4Q23, positively contributing to GDP growth.
Also, on Thursday, manufacturing production for January will be released. Manufacturing output expanded by 0.7% y/y in December, marking a moderate improvement from the 2.5% y/y expansion in November 2023. However, seasonally adjusted output declined sharply by 1.7% m/m, reversing the 1.2% monthly expansion in November. The manufacturing sector's GVA lifted slightly by 0.2% q/q in 4Q23 after shrinking by 1.1% in the previous quarter.

Tables
The key data in review
| Date | Country | Release/Event | Period | Act | Prior |
|---|---|---|---|---|---|
| 5 Mar | SA | GDP %y/y | 4Q | 0.1 | -0.2 |
| 6 Mar | SA | Business confidence index | 1Q | 30.0 | 31.0 |
| 7 Mar | SA | Gross foreign reserves $ billion | Feb | 61.7 | 61.2 |
| SA | Current account balance R billion | 4Q | -165.5 | -34.4 | |
| SA | Current account balance % of GDP | 4Q | -2.3 | -0.5 | |
| SA | Electricity production %y/y | Jan | 0.8 | 4.4 |
Data to watch out for this week
| Date | Country | Release/Event | Period | Survey | Prior |
|---|---|---|---|---|---|
| 11 Mar | SA | FNB/BER Building Confidence Index | 1Q | 43 | |
| 14 Mar | SA | Mining production %m/m | Jan | -4.2 | |
| SA | Mining production %y/y | Jan | 0.6 | ||
| SA | Manufacturing production %m/m | Jan | -1.7 | ||
| SA | Manufacturing production %y/y | Jan | 0.7 |
Financial market indicators
| Indicator | Level | 1W | 1M | 1Y |
|---|---|---|---|---|
| All Share | 73,604.11 | 1.2% | -1.3% | -5.3% |
| USD/ZAR | 18.68 | -2.7% | -0.8% | 0.4% |
| EUR/ZAR | 20.41 | -1.6% | 0.8% | 4.2% |
| GBP/ZAR | 23.87 | -1.3% | 0.7% | 8.6% |
| Platinum US$/oz | 922.70 | 5.4% | 2.1% | -1.5% |
| Gold US$/oz | 2,155.99 | 5.5% | 5.9% | 18.9% |
| Brent US$/oz | 82.48 | -1.4% | 4.9% | -0.2% |
| SA 10 year bond yield | 10.92 | -0.4% | 2.2% | 1.7% |
FNB SA Economic Forecast
| Economic Indicator | 2021 | 2022 | 2023f | 2024f | 2025f | 2026f |
|---|---|---|---|---|---|---|
| Real GDP %y/y | 4.7 | 1.9 | 0.6 | 1.3 | 1.6 | 1.8 |
| Household consumption expenditure % y/y | 5.8 | 2.5 | 0.7 | 1.4 | 1.6 | 1.8 |
| Gross fixed capital formation % y/y | 0.6 | 4.8 | 4.2 | 4.4 | 4.4 | 3.8 |
| CPI (average) %y/y | 4.5 | 6.9 | 6.0 | 5.2 | 4.6 | 4.5 |
| CPI (year end) % y/y | 5.9 | 7.2 | 5.1 | 4.8 | 4.8 | 4.5 |
| Repo rate (year end) %p.a. | 3.75 | 7.00 | 8.25 | 7.50 | 7.00 | 7.00 |
| Prime (year end) %p.a. | 7.25 | 10.50 | 11.75 | 11.00 | 10.50 | 10.50 |
| USDZAR (average) | 14.80 | 16.40 | 18.50 | 18.70 | 17.70 | 18.30 |