What are Fibonacci retracements and how do they work?
The mathematically significant Fibonacci sequence defines a set of ratios known as Fibonacci retracements, which help traders pinpoint crucial levels of support and resistance in equities. Fibonacci retracements are easy to understand since they are fixed, unlike moving averages. Fibonacci retracements can be used to determine probable entry and exit points for trading equities when paired with additional momentum indicators. The Fibonacci retracement levels are 23.6%, 38.2%, 61.8%, and 78.6%. While not officially a Fibonacci ratio, 50% is also commonly referenced.
What do Fibonacci retracements indicate?
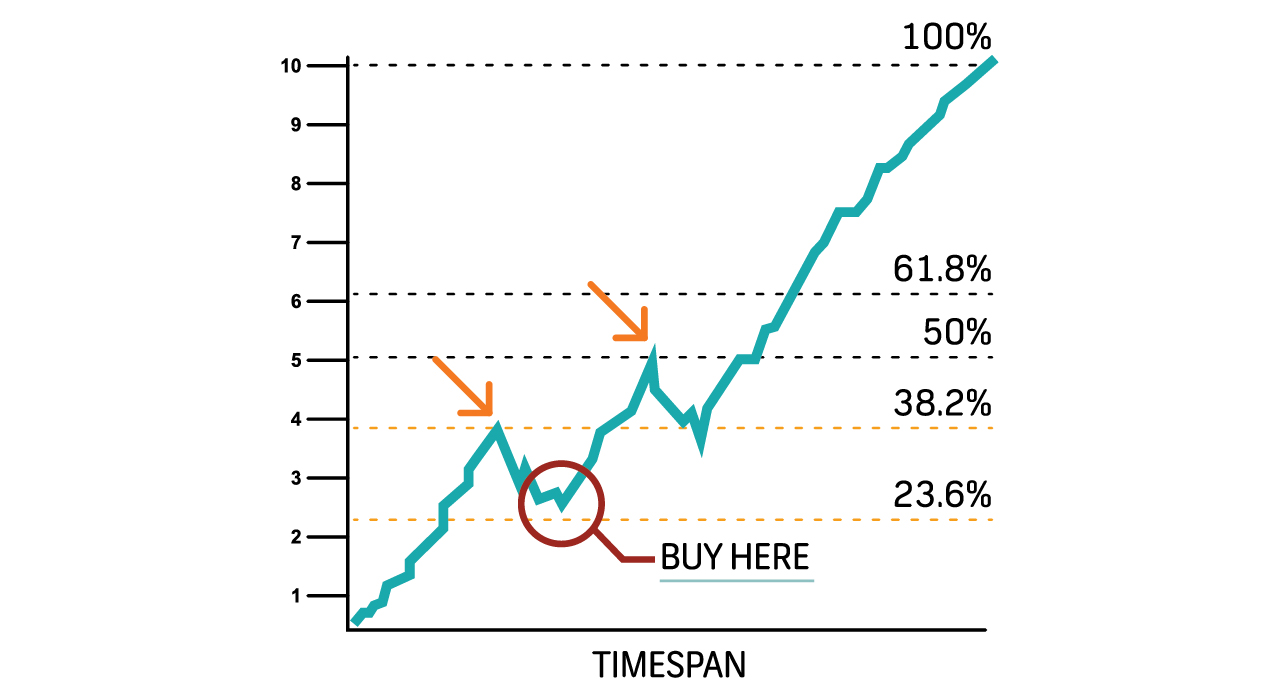
An equity price's support and resistance levels are identified using Fibonacci retracements. Fibonacci retracements are determined by the size of the previous bullish or bearish run. They do not change daily like moving averages do. As a result, Fibonacci sequences make it easier to identify support and resistance levels. Fibonacci retracements can be used to set stop-losses, price goals, and entry levels. Investor education 11 November 2022 By way of an example, a trader observes a stock price rising. It climbs before retracing to the 61.8% mark. Then, it starts to rise once more. The trader decides to purchase the stock because the rebound took place at a Fibonacci retracement level during an uptrend. A return to below that level may be a sign that the rally has failed, so the trader may put a stop loss at the 61.8% level. There are other areas of technical analysis where Fibonacci retracement levels appear, including in Elliott Wave theory and Gartley patterns. These techniques also ascribe to the theory that reversals frequently take place near Fibonacci levels following a large price upswing or downturn. Because Fibonacci retracement levels remain constant for some time, they are easy to identify.
Drawbacks of using Fibonacci retracement levels
There is no guarantee that a price will halt at a retracement level, which is why retracement levels are best utilised with other confirmatory indicators such a "bounce" off the level.Because there are so many Fibonacci retracement levels, the price may reverse around any one of them, making it difficult to predict which one to trade off.
How do you calculate Fibonacci Retracements
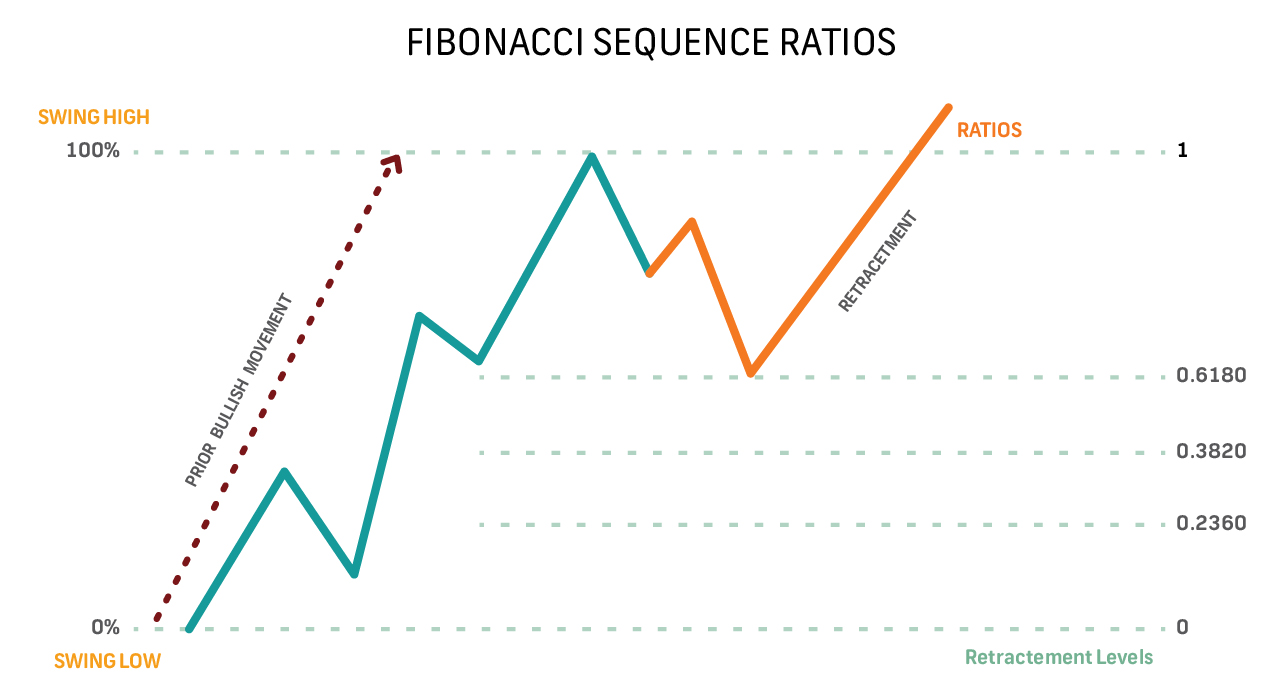
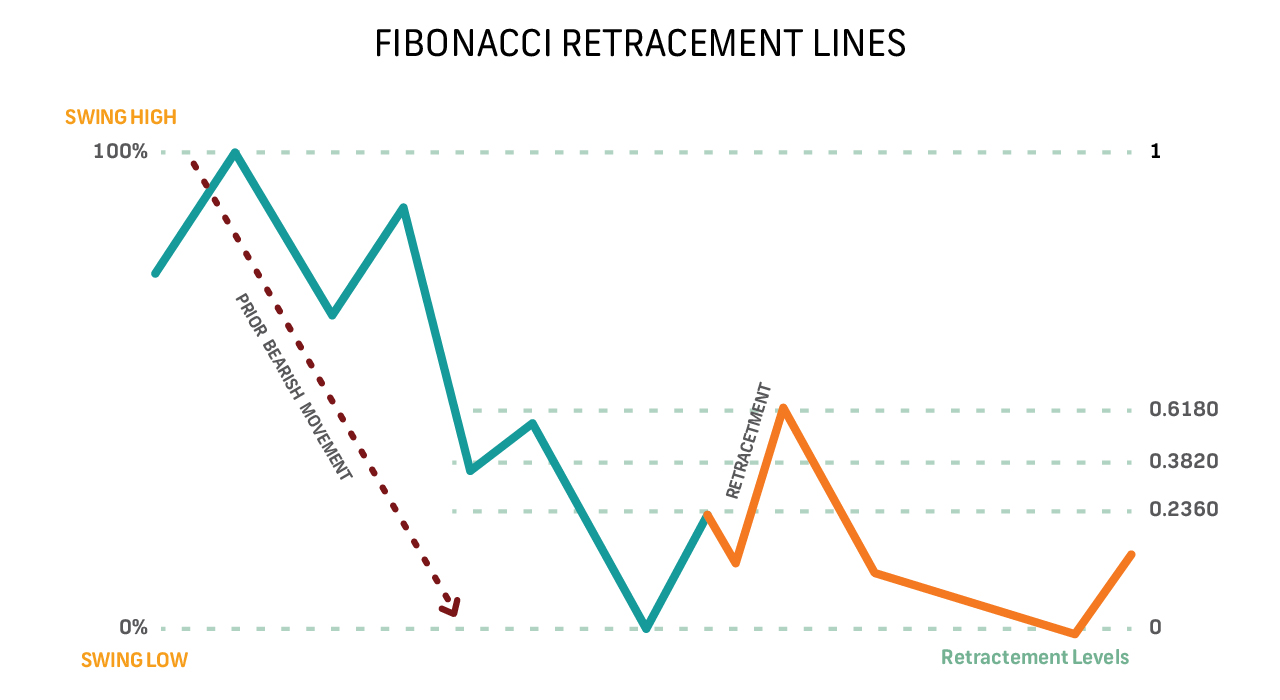
The Fibonacci sequence, in which each subsequent number is the addition of the prior two numbers, is the foundation of Fibonacci retracements. The golden ratio, or 1.6180, appears when any number in a Fibonacci sequence is divided by the number after it, while any number when divided by its predecessor produces the ratio 0.6180. Any number in the sequence can be divided by a number two spots in advance to get 0.3820, and by a number three positions in advance to get 0.2360. In nature, mathematics, and architecture, these ratios are seen everywhere Retracement levels are based on previous bullish or bearish action. First, a trendline is drawn from the low to the high of a prevailing trend. Then, Fibonacci retracement lines are drawn at 61.80%, 38.20%, and 23.60% of the line's height. Retracement lines for bullish movements begin at the movement's peak (the 23.60% line is closest to the peak of the movement), but for bearish movements, retracement lines are calculated from the bottom (the 23.60% line is closest to the bottom).
How do you then trade with Fibonacci retracements?
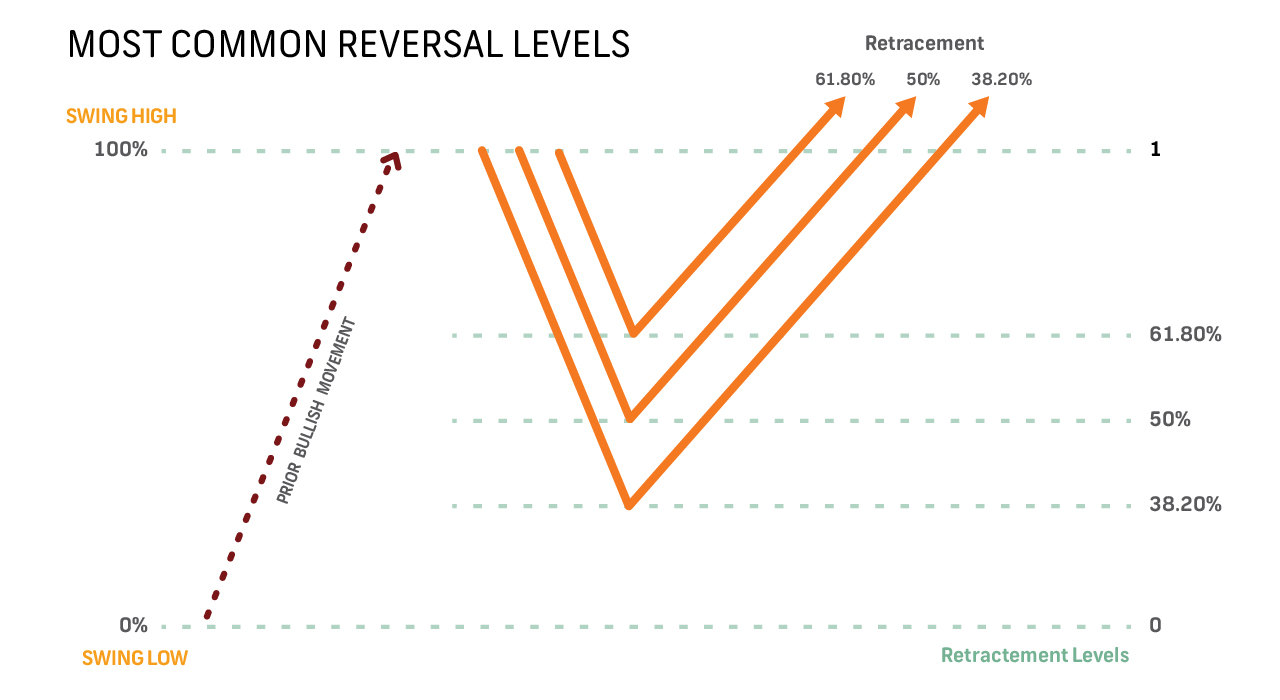
Fibonacci retracements can be plotted on a chart to help you predict turning points where possible support or resistance can be found. They should show possible support levels (where a downtrend will turn bullish if founded on a bullish movement) or resistance levels (where a rebound will be reversed bearishly if on a bearish swing). The most frequent reversals take place at 38.20%, 50%, and 61.80% (50% is derived not from the Fibonacci sequence but rather from the idea that on average stocks retrace half their earlier movements).Retracements do happen near the 23.60% line, but they are less common and need to be watched closely because they start quite soon after a reversal. When retracement lines cross a significant moving average, such as a 50- or 200-day simple moving average, they can often be viewed as stronger support and resistance levels. When using Fibonacci retracements, bear in mind that retracement lines are not actual buy and sell signals but rather potential levels of support and resistance. To determine when support or resistance genuine, it is crucial to use additional or confirmatory technical indicators. The likelihood of a reversal increases as more new evidence points in that direction.
