Hartford is an investment and insurance company. It provides a range of insurance products including property and casualty insurance, group benefits, and mutual funds. Hartford operates mainly in the United States (US) and generates 95% of its revenue from the US market, with the rest coming from Europe and other international regions.
The company's strategic approach emphasises advancing underwriting excellence, improved digital capabilities, maximising distribution channels, optimising organisational efficiency, and advancing ESG leadership.
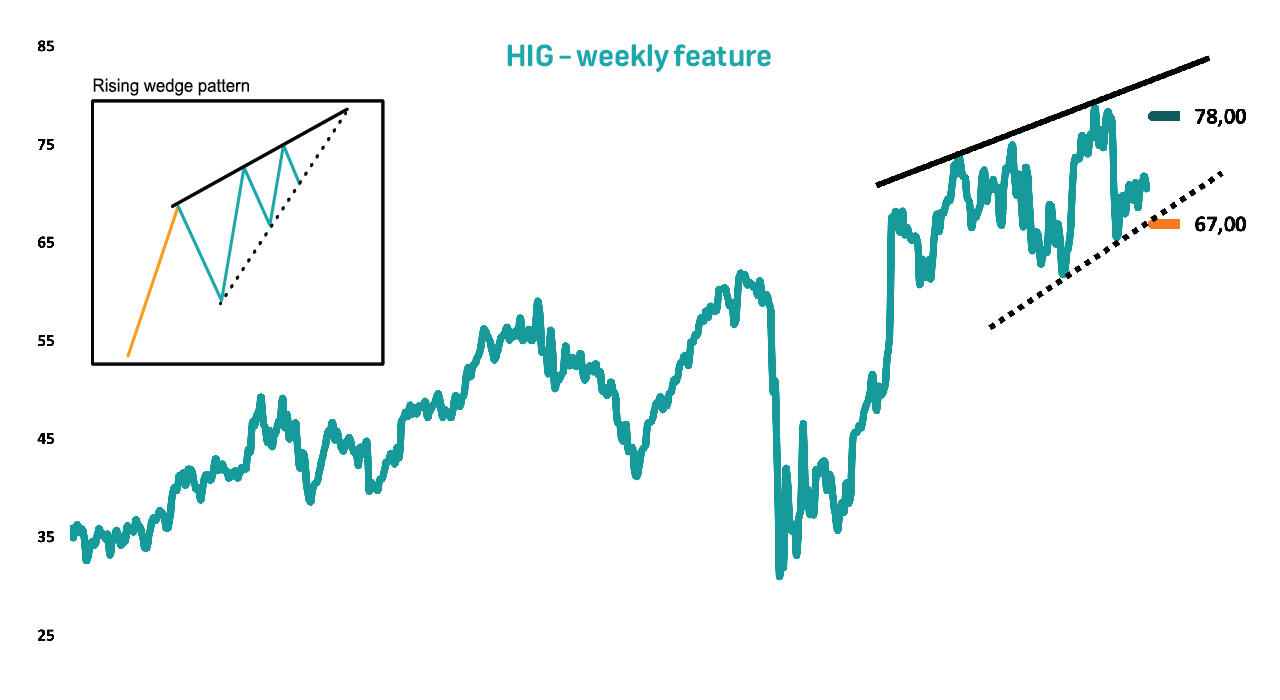
Technically, the price appears to be in the development stages of a rising wedge pattern (see the black converging trendlines as well as the insert). The pattern indicates a period of consolidation and indecision in the market before a potential continuation of the uptrend. The overall direction of the stock is upward, with higher highs and higher lows - a sign of increasing buying pressure.
Investors can take advantage of the price oscillations in the triangle by buying near the lower trendline (support) and selling near the upper trendline (resistance).
Additionally, the stock is trading close to its 200-day simple moving average (SMA) of ~$70.60, signalling a bullish price trend.
The Relative Strength Index (RSI) indicator, which currently has a reading of 44, and the recent sideways trajectory of the On-balance volume (OBV) indicator provides further support to our bullish view.
Share Information
| Share code | HIG |
|---|---|
| Industry | Insurance |
| Market Capital (USD) | 21.9 billion |
| One year total return | 11,04% |
| Return year-to-date | -5,81% |
| Current price (USD) | 70,60 |
| 52 weeek high (USD) | 79,44 |
| 52 week low (USD) | 60,17 |
| Financial year end | December |
| Closing paragraph | The share price retreated somewhat year-to-date; however, we've seen decent growth over the previous 12 months. With a beta of 1.03 we expect volatility in-line with the market. |
Consensus expectations
(Bloomberg)
| FY22 | FY23E | FY24E | FY25E | |
|---|---|---|---|---|
| Headline Earnings per Share (USD) | 7.56 | 8.05 | 9.68 | 11.05 |
| Growth (%) | - | 6,49 | 20.28 | 14.06 |
| Dividend Per Share (USD) | 1.58 | 1.70 | 1.84 | 1.97 |
| Growth (%) | - | 7.53 | 8.12 | 6.97 |
| Forward PE (times) | - | 8.77 | 7.29 | 6.39 |
| Forward Dividend Yield (%) | - | 2.41 | 2.60 | 2.78 |
| Closing paragraph | Growth expectations are robust over the medium term, with demand being bolstered by positive secular trends. | |||
Buy/Sell Rationale
Technical Analysis:
Long-term fundamental view:
Update on previous Trade Ideas
| Share Name and position |
HLMN - Buy (Continue to hold) |
HACK - Buy (Continue to hold) |
VXF - Buy (Continue to hold) |
|---|---|---|---|
| Entry | 8.01 | 47.58 | 139.26 |
| Current | 9.11 | 50.42 | 147.10 |
| Movement | 13.7% | 6.0% | 5.6% |
| Summary text |
The price continues to display repetitive cycles in sequences. The stock remains above its 200-day simple moving average. Upside momentum further supports the trade.
Our profit target is $10 with a trailing stop-loss at $8.35. Exit the position on 6 October 2023. |
The price remains above critical support and trade continues above the 200-day simple moving average. Upside momentum supports the bullish bias.
Our profit target is $55 with a trailing stop-loss of $48.50. Exit the position around 4 August 2023. |
An incomplete symmetrical triangle pattern remains of interest. The ETF is trading above its 200-day simple moving average. Upside momentum supports the bullish trend.
Our profit target is $153 with a trailing stop-loss at $141. Exit the position on 2 November 2023. |
Update on previous Trade Ideas
| Share Name and position |
LIT - Buy (Continue to hold) |
COST - Buy (Continue to hold) |
AIG - Buy (Continue to hold) |
|---|---|---|---|
| Entry | 62.48 | 501.27 | 56.08 |
| Current | 65.35 | 519.70 | 54.72 |
| Movement | 4.6% | 3.7% | 2.5% |
| Summary text |
The stock is trading in a falling wedge pattern within a previous uptrend. The stock is testing its 200-day simple moving average. Upward momentum provides support for a bullish price movement
Our profit target is $71 with a trailing stop-loss at $62. Exit the position on 30 August 2023 |
We continue to observe a confluence of technical indicators that aligns with a bullish trend. The share is trading above its 200-day simple moving average. Upside price momentum supports a bullish bias.
Our profit target is $560, with a trailing stop-loss of $498. Exit the position around 7 July 2023. |
The stock is currently displaying a broadening top pattern, with the price trending slightly above its 200-day simple moving average. The continued Upside price momentum supports a bullish bias
Our profit target is $62, with a trailing stop-loss of $52.65. Exit the position around 2 August 2023 |