The iShares MSCI Emerging Markets ETF provides investors with effective exposure to the investment performance of the MSCI Emerging Markets Total Return (TR) Index. This is comprised of several large-and mid-cap stocks operating in various industries including finance, technology, consumer discretionary, and materials, among a few others.
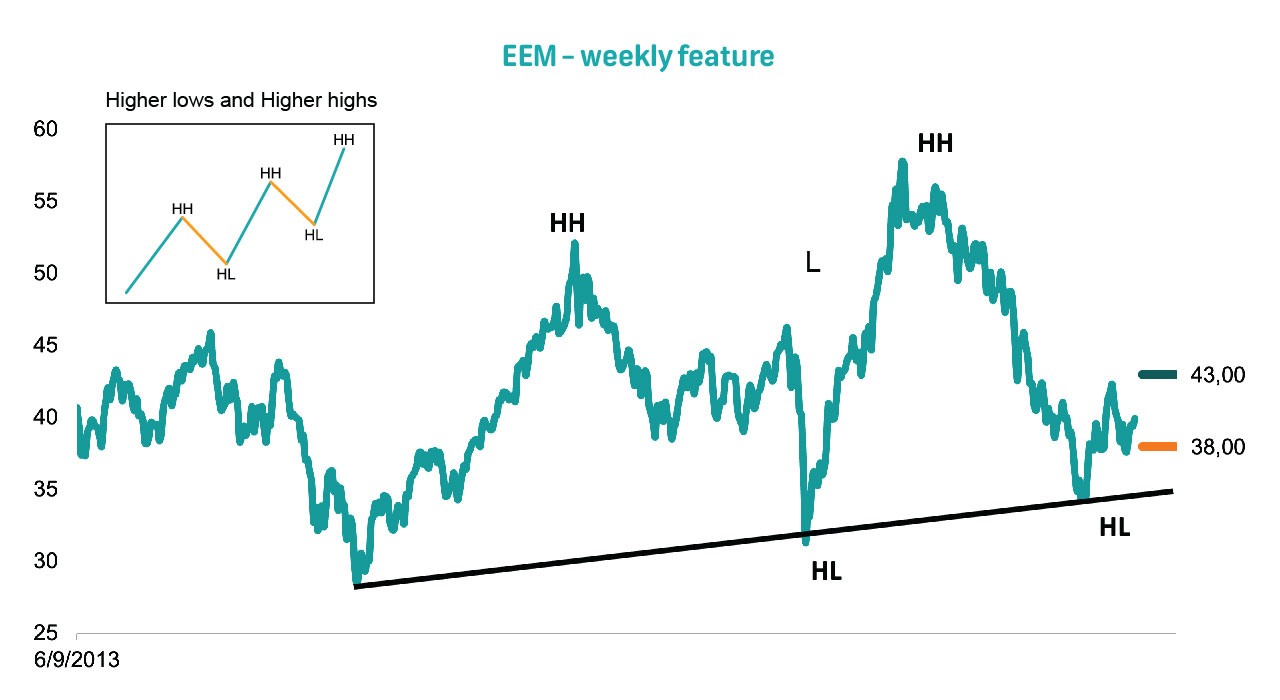
Technically, the ETF price is displaying a pattern of higher highs (HH) and higher lows (HL), suggesting a bullish trend (see the main chart as well as the insert). In essence, the ETF is undergoing a series of price retracements that extend beyond previous highs and don't fall below previous lows.
The ETF is trading just above its 200-day simple moving average of ~$38.50 - this is a positive indicator of the price trend.
Strong upside momentum, according to the MACD indicator, as well as sidewards movement of the OBV indicator, supports our bullish stance.
Share Information
| Share code | EEM |
|---|---|
| Industry | ETFs |
| Market capatalisation (USD) | 24.96 billion |
| One year total return | -7.56% |
| Return year-to-date | 5.36% |
| Current price(USD) | 39.93 |
| 52 weeek high(USD) | 44.59 |
| 52 week low(USD) | 33.49 |
| Financial year end | - |
| Closing paragraph | We expect moderate price volatility going forward. |
Buy/Sell Rationale
Technical Analysis:
Fundamental view:
| Share Name and position |
BDRY - Profit take (Close the position) |
EXR - Profit take (Close the position) |
AAPL - Profit take (Close the position) |
|---|---|---|---|
| Entry | 9.05 | 157.83 | 153.71 |
| Current | 9.37 | 158.79 | 165.56 |
| Movement | 3.5% | 0.6% | 7.7% |
| Summary text |
Upside price momentum has come to a halt.
We suggest taking profits before a further deterioration in technicals. |
Upside price momentum has come to a halt.
We suggest taking profits before a further deterioration in technicals. |
Profit level is above our 60% hurdle rate.
Exit the trade to reduce overall portfolio exposure. |
| Share Name and position |
XLK - Profit take (Close the position) |
CBOE - Buy (Continue to hold) |
MSFT - Buy (Continue to hold) |
|---|---|---|---|
| Entry | 139.66 | 127.18 | 276.20 |
| Current | 149.48 | 135.17 | 289.84 |
| Movement | 7.0% | 6.3% | 4.9% |
| Summary text |
Profit level is above our 60% hurdle rate.
Exit the trade to reduce overall portfolio exposure. |
The defensive nature of the stock remains of interest. The price remains above its 200-day simple moving average. Upside momentum supports the bullish trend.
Our profit target is $144.00 with a trailing stop-loss at $128.70. Exit the position on 2 June 2023. |
The stock price recently breached a major resistance level. The stock is trading above its 200-day simple moving average, but upside momentum has halted - a concern to the bullish trend.
Our profit target is $300.00, with a trailing stop-loss of $271.80. Exit the position around 9 June 2023. |